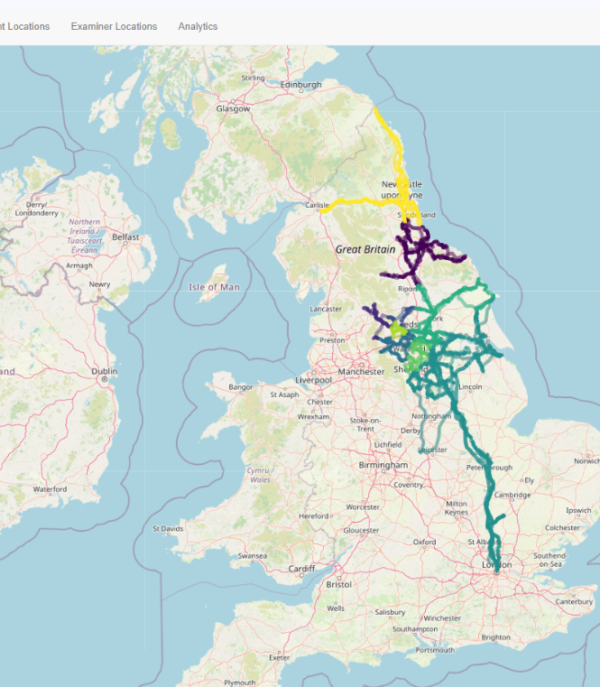
Network Rail (NR) Eastern Region Buildings and Civils Route Engineering Team have circa 20,000 structures to examine and maintain from Newcastle to London on one of the most congested networks in the country. Logistical and resource challenges of maintaining a highly complex route, resulted in visual inspections of structures falling short of 400 per week required to maintain ORR compliance.
Due to a combination of specified tolerance-based inspection dates and reactive routing between examinations this was driving inefficient and unproductive working, increasing OPEX costs.
The NR Eastern Building and Civils team wanted support to proactively resolve the problem and identifying creative ways to improve the current output. This aligns with the SPEED principal which is at the core of Eastern Region.
NR contacted D2 with the challenge of determining the optimal solution for NR’s Visual Examination regime and to produce a compliant & non-compliant transition plan vs. the 2022 dataset.
D2 established a multi-disciplinary team combining its rail industry Project Management experts with its Data Science team. The D2 team worked closely with the NR Examination team to clarify requirements, constraints and working practices.
D2 quickly identified that the problem to be solved was a logistical mathematical problem known as the ‘travelling salesman problem’ (TSP).
The TSP can theoretically be solved to determine the optimal solution using mathematical modelling. However, to find the fully optimized solution is extremely expensive in terms of computational power and time. To mitigate this, D2 developed an alternative probabilistic set of heuristic algorithms and created an optimization tool to calculate highly optimized solutions with significantly less computational power.
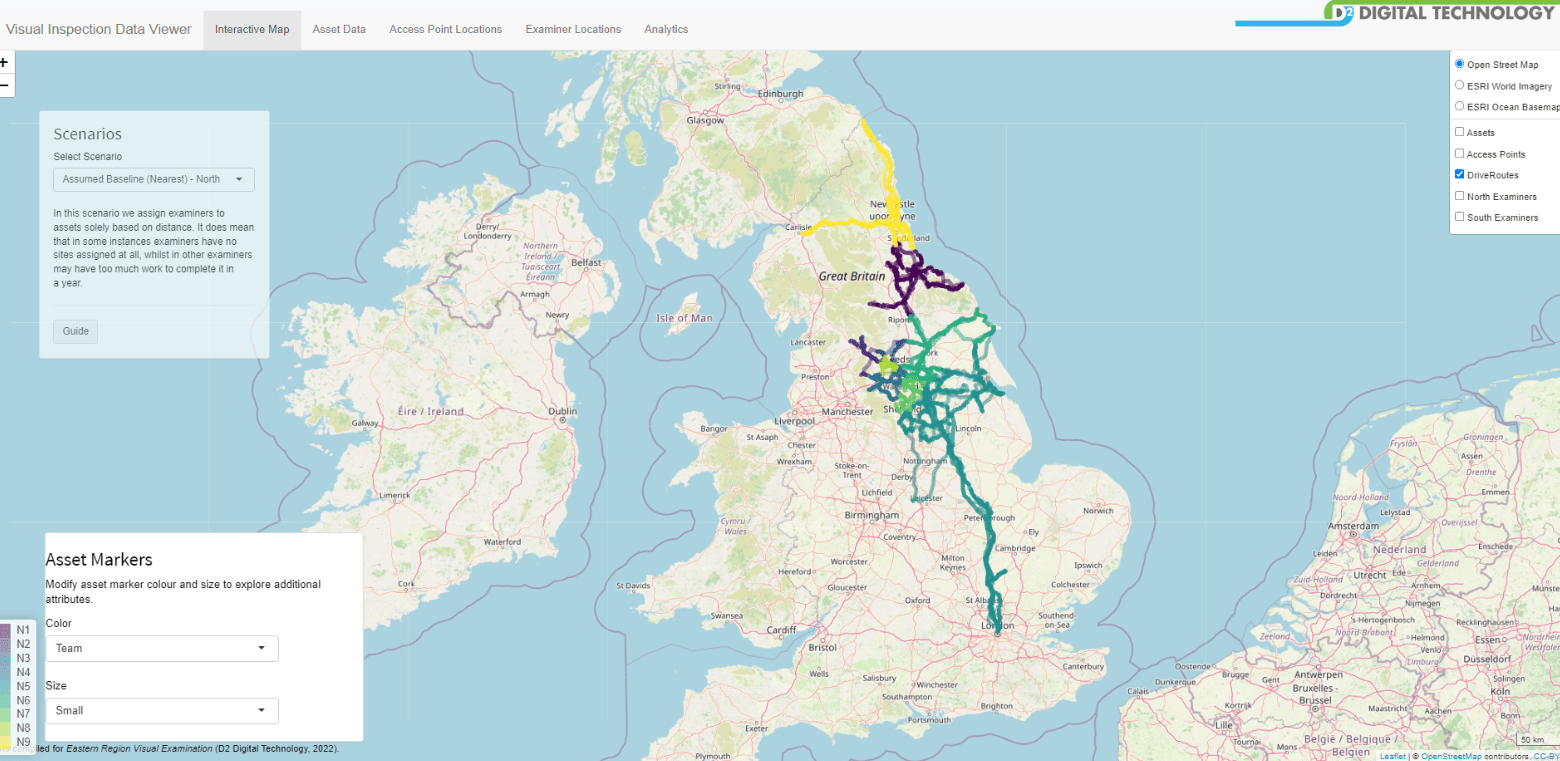
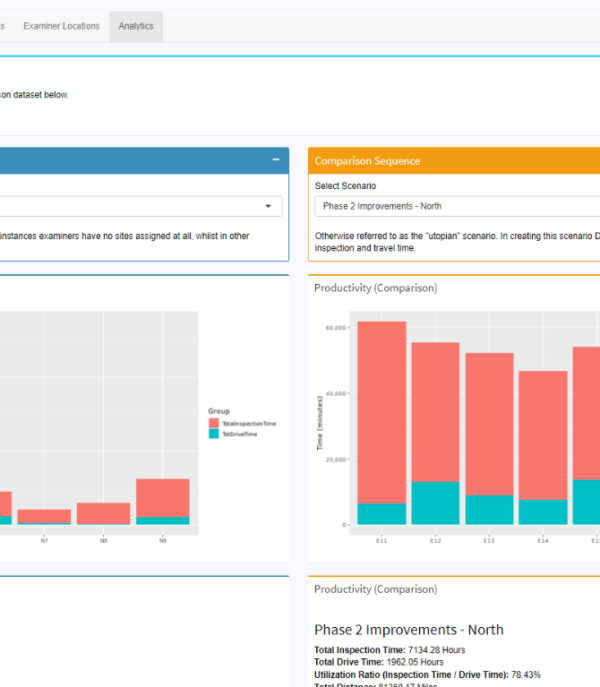
D2 built a front-end simple user interface to the optimisation tool to allow NR to easily visualise the efficiency and productivity improvements.
Benefits of D2’s Optimised Solution
Through the optimisation of Network Rail’s Visual Examinations, D2 enabled the following improvements:
D2’s unique position in the market as an agile SME with industry rail experts and a dedicated digital technology and data science team led NR’s Head of Asset Management from the Eastern Region to request our help in clearing a backlog of visual examinations.
The most significant challenge that we faced was obtaining a complete set of data at the start of the project. The D2 team collaborated with NR Structures Team to collate the necessary data and make informed assumptions to enable an assumed baseline to be created. We collectively decided that the assumed baseline went straight to Phase 1 Optimisation which optimised allocation of assets to inspectors. The 18.4% efficiency and 37% productivity improvements was the improvement from Phase 1 to Phase 2 Optimisation (optimisation of examiner locations based on targeted recruitment). Hence, we expect the overall levels of optimisation from the true baseline to Phase 2 to be much higher than shown.
We needed to ensure that our solutions were based on actual working practices (which often differ subtly from prescribed procedures). To improve understanding of the challenges faced by the NR on-site teams, we shadowed NR’s Inspection teams over several days onsite which provide valuable insight that could be factored into the model.
The information captured from this exercise helped us to consider human factors when modelling the solutions. This resulted in outputs that were realistically achievable with minimal need for inspectors to change how they completed their work. A key example was average walking speed. We found that walking on ballast took on average, 50% longer than walking on normal highways conditions. So, we reduced baseline walking speed assumptions within the model to improve accuracy.
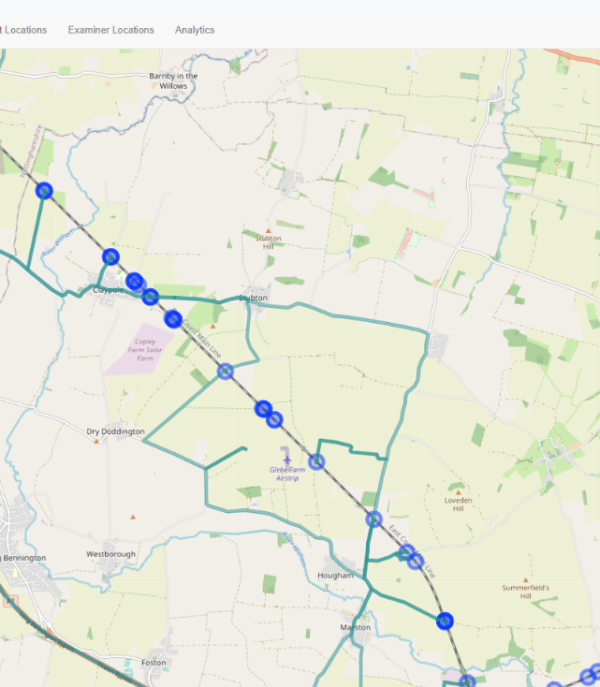
To produce the outputs needed to realise the required efficiencies, our Data Science experts constructed modelling algorithms that linked assets with access points, determined optimal base locations for inspectors, achieved manageable workload distributions, optimised travelling time, and set out realistic inspection dates.
There were several key assumptions that we either coded into the model as fixed or variable constraints. This enabled the client to specify which assets required track access and which assets had additional complexity. These variables could be manipulated via a simple front end user interface enabling NR to create their own bespoke scenarios. The user interface also enabled NR to easily visualise the efficiencies and productivity improvements presented by each scenario. To help NR we provided them with training on the system and provided them access to the tool for future use.
The outputs of our study included the optimal and utopia solutions, a compliant and non-compliant transition plan, a report, and a web-based user interface to the data analytics model. All were positively received and due to the level productivity and efficiency improvement highlighted; this generated a significant level of interest not only from the structural examination team but other NR teams such as the geotechnical team.
To support NR, we provided a nine-point improvement plan ranging from short-term improvements such as reallocating members of their team to different geographical regions; to more long-term improvements such as targeted recruitment to enable optimal allocation of assets to examiners. A key recommendation was to continue to develop the D2 optimisation tool into a full planning tool so that it could not only deal with static datasets but so that it could also deal with dynamic datasets that adapt to the onsite changing environment. Once developed, this technology could easily be rolled out to other regions within NR to enable full optimisation of visual examinations on a national level.
Because the principles of the D2 optimisation tool have been built on optimising cyclical examinations for geographically spread assets, it can easily be applied and adapted to any routine-based activities such as maintenance. We are currently preparing to showcase the project to the NR Executive team to show them the benefits of translating the tool into a full planning tool; as well as exploring which other areas NR would like optimise. In the current economic climate where NR have limited budgets there has never been a better time to invest in technology to optimise working practices.